
Dashboard
General Stats
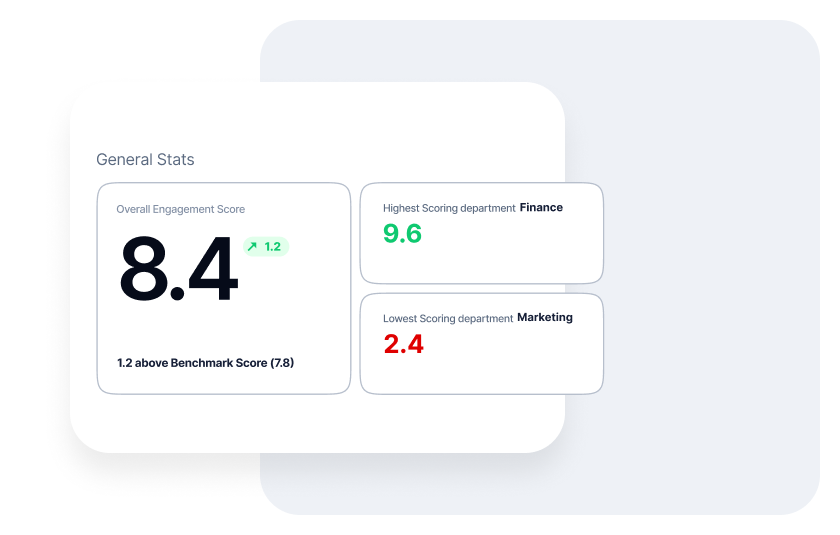
Learn what your organization’s overall engagement score is, how it compares to the previous month and the benchmark score. The “General Stats” section also displays the percentage of error margin, as well as, the highest and lowest scoring locations, departments, job functions, and managers.

Top Alerts
Improve underperforming areas by keeping an eye on the "Top Alerts" section, where we will push engagement alerts your way to help you prioritize the actions you need to take and focus on the segments and employee clusters with significantly low scores.

Response Rate
Get a pulse on how useful and relevant the surveys you dispatch are to employees by monitoring how they interact with them. The “Response Rate” section will show you the percentage of answered surveys, how it compares to the previous month, the number of monthly dispatched, as well as, their open and completion rates.

Employee NPS
Measure your employees’ willingness to recommend your organization as a place to work, via the “Employee NPS”. This section will display your organizations’ overall Net Promoter Score, where the highest score is 100% and the lowest is -100% and will enable you to see the exact percentages of promoters, passives, and detractors.

Engagement Score History
Score History chart shows how the score of this attribute changed over time (for the selected segment) in comparison to the score for the entire organization

Employee Attributes
Identify your organization’s areas of strengths and weaknesses by taking a quick glance at the “Employee Attributes” section. These attributes are based on our Engagement Model and are designed to provide you with insights into the main drivers of engagement within your organization, and their impact.

Employee Segments
Build a better understanding of the employee experience at your organization by uncovering the best and worst-performing segments. The “Employee Segments” section will enable you to see a list of employee segments with the highest and lowest engagement scores. You can change the selection to view engagement scores according to different segments.