
Response Rate Manager

Response Rate
Get a pulse on how useful and relevant the surveys you dispatch are to employees by monitoring how they interact with them. The “Response Rate” section will show you the percentage of answered surveys in the past month and 12 months, how it compares to the previous month and how it compares to the previous 12 months, the number of monthly dispatched, as well as, their open and completion rates.
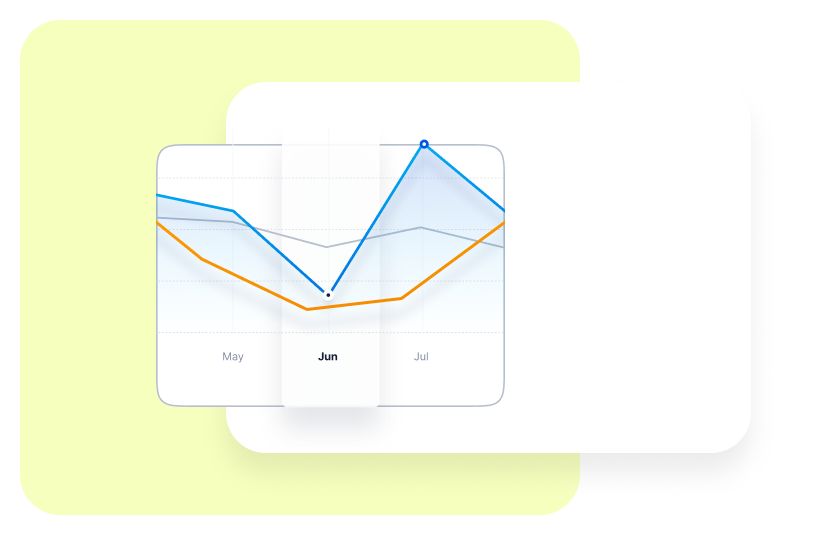
Response Rate History
Gain a visual overview of how the survey response rate has changed over time. The “Response Rate History” graph will enable you to keep track of and compare the number of dispatch, opened and, completed surveys, at any point in time.

Managers and Departments Breakdown
This view helps you identify the managers and the departments with the highest and lowest response rates among their teams. Use this information to celebrate the top performers and follow up with the low performers.