
كيف يَكشف تحليل الاندماج المبني على الأقدمية احتمالات الاستقالة
December 15, 2025
|
5 دقائق قراءة


%20(1).svg)
لا يعيش الموظفون تجربة واحدة داخل المؤسسة؛ فالموظف الجديد يرى الشركة بعيون مختلفة تمامًا عن زميل أمضى فيها عامين أو أكثر. ومع مرور الوقت، تتغير التوقعات والانطباعات، وغالبًا ما تكون هذه التحولات هي الشرارة الأولى لفقدان الاهتمام والتفكير في ترك العمل. وهنا تُعتبر"مدة الخدمة" أداة عملية للتنبؤ بمخاطر الاستقالة، فهي ترصد بدقة بداية تراجع معدلات الاندماج الوظيفي.
نستعرض في هذا المقال تحولات "منحنى الاندماج الوظيفي" عبر مراحل الخدمة المختلفة، وكيف تمكنك حلول "إنغيجسوفت" الذكية من تحديد المراحل الحسّاسة في دورة حياة الموظف التي تبدأ فيها احتمالات الاستقالة بالظهور قبل فوات الأوان.
تحليل منحنى الاندماج الوظيفي عبر سنوات الخدمة
عند تحليل نتائج الاندماج بناءً على مدة الخدمة، تُظهر البيانات نمطًا متكررًا في معظم المؤسسات؛ حيث يتخذ المنحنى شكلًا متشابهًا حتى وإن اختلفت التوقيتات الدقيقة. لذا فإن فهم هذا المنحنى يُعد الركيزة الأساسية للتنبؤ بالاستقالات قبل وقوعها.
1. مرحلة "الحماس والاندفاع"
يصل الاندماج الوظيفي إلى ذروته لدى الموظفين الجدد نتيجة تجربة:
- تحديات مهنية جديدة.
- دافع قوي للإنجاز.
- فضول مهني تجاه المهام الوظيفية.
- تفاؤل ملموس بفرص التطور المهني.
ويُعد هذا الارتفاع المبكر في مستويات الاندماج ظاهرة طبيعية تظهر في مختلف القطاعات والتخصصات الوظيفية.
2. مرحلة "الانحدار" (منطقة الخطر الحقيقية)
مع مرور الوقت، بمجرد أن يصبح العمل معتادًا (روتينيًّا)، يبدأ الاندماج في الانخفاض تدريجيًّا. وبينما تختلف الفترات الزمنية بين الشركات، تُشكل "فترة العامين" في الغالب نقطة تحول كبرى؛ حيث يقل حماس الموظفين تجاه فرص التطوير والتعلم المتاحة.
من الضروري جدًّا تحديد التوقيت الدقيق لهذا الانخفاض داخل مؤسستك، فهي اللحظة التي يبدأ فيها الموظفون إعادة تقييم سقف توقعاتهم. في هذه المرحلة (المعروفة بـ "مرحلة الانحدار")، تبدأ بوادر الرغبة في ترك العمل بالظهور، وتتمثل في تراجع الشغف والحماس، وسلبيّة الانطباعات في الاستبيانات المفتوحة. وإذا لم يتم التدخل في الوقت المناسب، تتحول هذه المرحلة إلى "نقطة خروج" تفقد عندها المؤسسات مواهبها وكوادرها البشرية.
3. "التعافي" الظاهري بين الموظفين القُدامى
بعد مرحلة الانخفاض، ترصد العديد من المؤسسات ارتفاعًا جديدًا في مستويات الاندماج. ورغم أن هذا قد يبدو تطورًا إيجابيًّا، إلا أنه يحتاج إلى قراءة واعية.
في كثير من الأحيان، يكون هذا التحسن ناتجًا عما يُعرف بـ "انحياز البقاء" (Survival Bias)؛ حيث إن الموظفين الأكثر إحباطًا قد غادروا الشركة بالفعل، ومن تبقَّى هم فقط أولئك الأكثر مرونة والمتوافقون مع ثقافة الشركة. بعبارة أخرى، "التعافي" لا يعني دائمًا أن الموظفين أصبحوا أكثر سعادة، بل يعني أن غير السعداء قد رحلوا.

ومع ذلك، تشير بياناتنا إلى وجود بصيص أمل، وأن هذه الظاهرة ليست حتمية؛ فبعض الموظفين ينجحون بالفعل في التكيف وتجديد شغفهم. السر يكمن في التحقق من هذه البيانات بدقة بدلًا من الافتراض. إن فهم هذا المنحنى يمنحك "خريطة طريق للاحتفاظ بالمواهب" تخبرك بنقاط القوة والضعف في تجربة موظفيك، مما يمنحك الفرصة للتدخل في الوقت المناسب.
تسليط الضوء على "فجوة الاندماج"
بمجرد تحديد النقطة الزمنية للانخفاض أو الانحدار، يجب تحليل العوامل المؤثرة ضمن هذا النطاق الزمني المحدد؛ حيث إن هذا التراجع ليس وليد المصادفة، فكل شركة لديها نقطة حرجة يبدأ فيها الحماس بالخفوت. ومن خلال عزل بيانات الموظفين في هذه المرحلة، تصبح مسببات الاستقالة واضحة تمامًا.
تحليل الفجوة بذكاء (باستخدام أدواتنا المتطوّرة)
بمجرد تحديد النقطة الزمنية للانخفاض، تأتي خطوة فهم المسببات. هنا، يصبح تضييق نطاق التحليل على هذه المجموعة المحددة أمرًا ضروريًّا، وهو ما تتيحه أدوات "إنغيجسوفت" المتطوِّرة:
- الخرائط الحرارية (Heatmaps): تكشف عن الأسئلة التي تشهد انخفاضًا حادًّا لدى الموظفين في هذه المرحلة بدقة متناهية.
- تحليل المشاعر (Sentiment Analysis): لفهم النبرة الحقيقية خلف تعليقات الموظفين.
- بيانات مقابلات الاستقالات (Exit Data): تظهر ما إذا كان الموظفون المغادرون خلال هذه الفترة يذكرون أسبابًا متشابهة (بمعنى آخر، للربط بين أسباب الاستقالة وتوقيتها).
- عوامل تصفية مدة الخدمة (Tenure Filters): لعزل بيانات هذه الفئة ودراستها بعمق بعيدًا عن أي مؤثرات خارجية.
تساعدك هذه الأدوات على رصد الإشارات الأولية لمخاطر ترك العمل أو التسرُّب الوظيفي. هل تريد اكتشاف هذه الفجوة أو الأنماط في شركتك، احجز عرضًا تجريبيًّا مخصّصًا الآن مع فريقنا .
من المهم أيضًا فحص الاختلافات الجوهرية عبر الأدوار والوظائف؛ فكل مجموعة تمر بدورة حياة الموظف بوتيرتها الخاصة، ولا تتضح هذه الاختلافات إلا عند النظر في منحنياتهم بشكل منفصل. على سبيل المثال:
- المبيعات: تظهر إشارات الإرهاق الوظيفي غالبًا حول الشهر السادس.
- الهندسة: تظهر الفجوات لاحقًا، عادةً بين 18-24 شهرًا بسبب إرهاق المشاريع أو الركود التقني.
- الموظفون في بداية مسيرتهم: ينخفض الاندماج عندما يتراجع الإرشاد أو التوجيه.
- كبار الموظفين: تظهر الفجوات عندما يضعف التوافق الاستراتيجي أو تصبح عملية صنع القرار غير واضحة.
اتخاذ القرارات بناءً على البيانات لا الافتراضات
يفترض الكثير من القادة أن الراتب أو ضغط العمل أو مسارات الترقية هي الأسباب الوحيدة لرحيل المواهب، لكن البيانات غالبًا ما تكشف قصصًا أخرى. لذا، دع بيانات "إنغيجسوفت" تقودك إلى السبب الحقيقي، سواء كان غياب المسار المهني أو الإرهاق الوظيفي أو التوقّعات المحبطة. فمن خلال تحليل الخرائط الحرارية، وتحولات المشاعر، ومقابلات الاستقالات الخاصة بموظفيك، يمكنك كشف العوامل الحقيقية وراء عدم الاندماج، لتتمكن من بناء استراتيجية استبقاء قائمة على الحقائق لا على التوقعات.
الأسباب الشائعة لتراجع الاندماج الوظيفي خلال "مرحلة الانحدار"
بعد أن حددنا مكان "فجوة الانخفاض" وفحصنا بيانات الموظفين في تلك المرحلة، ننتقل الآن إلى فهم الأسباب التي تدفع الاندماج للتراجع عادةً في هذا التوقيت.
من خلال تجاربنا مع شركائنا في السعودية ومصر ومنطقة الشرق الأوسط عامة، لاحظنا وجود أنماطٍ متكررة يمر بها الموظفون في هذه المرحلة. ولكن تذكروا دائمًا أن هذه الأنماط هي مجرد بداية للبحث وليست حقائق ثابتة لكل شركة. إليكم أبرز ما رصدناه:
- النمط الأول: الفجوة بين التوقّعات والواقع
يدخل الكثير إلى وظائفهم بصورة مثالية مليئة بالحماس رسموها خلال مرحلة التوظيف. ومع الوصول إلى "مرحلة الانحدار"، تبدأ التعليقات في كشف تزايد الفجوة بين تلك التوقعات والواقع اليومي. قد يظهر هذا في صورة شعور بالإحباط أو تساؤلات حول مدى ملاءمة الوظيفة لطموحاتهم على المدى البعيد.
ومع إتمام العام الأول، يبرز التساؤل حول "سرعة النمو"؛ فإذا لم يلمس الموظف تطورًا واضحًا، يبدأ اندماجه الوظيفي في التراجع بشكل حاد.
- النمط الثاني: تضاؤل الدعم وفرص التعلم
في الأشهر الأولى، يحظى الموظف باهتمام كبير وتدريب مستمر، ولكن مع مرور الوقت، قد يبدأ هذا الدعم في التلاشي. يبدأ الموظفون بوصف شعورهم بنقص التوجيه أو تراجع فرص التعلم مقارنة بالبداية، مما يولد لديهم إحساسًا بالركود المهني.
- النمط الثالث: زيادة أعباء العمل مع غياب الدعم الكافي
في بعض التخصصات، تكبر المسئوليات بشكل أسرع من وضوح المهامِّ المطلوبة. قد يشعر الموظف بأنه مطالب بأداء عالٍ دون توجيه كافٍ أو موارد تدعمه، وهو ما يترجم في تعليقاتهم إلى شعور بالتوتر أو التشتت أو غموض التوقّعات.
بمجرد اكتشاف هذه العوامل في شركتك، ستتمكن من اتخاذ إجراءات تصحيحية مدروسة تعالج هذه النقاط قبل أن تؤدي إلى تراجع مستويات الاندماج لدى الموظفين.
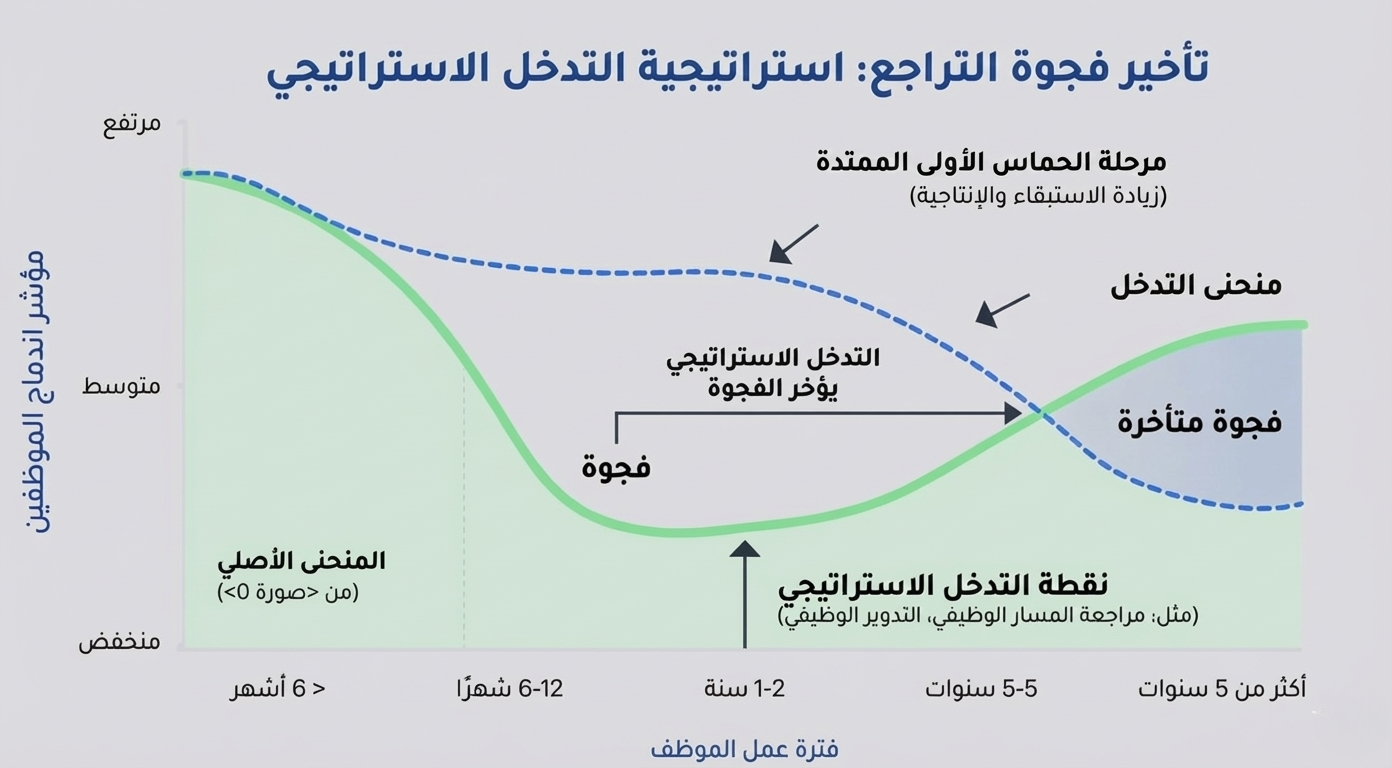
الهدف: تأخير ظهور "منحنى الهبوط"
السؤال الحقيقي هو: كيف نغير مسار "مرحلة الانحدار" أو "منحنى الهبوط"؟ يعني ذلك دعم الموظفين خلال الأشهر اللاحقة من رحلتهم الوظيفية لمنع تراجع الحماس مبكرًا، دون الاعتماد على تحفيز مصطنع.
الأمر لا يتعلق بخلق حماس زائف، بل بمعالجة المشاكل الحقيقية التي تسبب فقدان الاندماج؛ فنحن نسعى لخلق بيئة عمل توفر دافعًا حقيقيًّا ومستدامًا يتجاوز العام الأول.
الفكرة بسيطة: إذا حافظنا على حماس الموظف لفترة أطول، سيظل منتجًا ومنتميًا للمؤسسة لفترة أطول أيضًا. فمن خلال تقديم الدعم الصحيح في الوقت المناسب، يمكننا تأخير ظهور "منحنى الهبوط" لعدة أشهر إضافية. هذه التغييرات البسيطة تمنحنا فترات أداء أطول، ومسارات نمو أوضح، وتقلل من حالات الاستقالة المفاجئة.
استراتيجيات تدخُّل ممنهجة
السر في تأخير "مرحلة الانحدار" يكمن في المبادرة الاستباقية. عليك تصميم إجراءات تعالج التحديات التي يواجهها الموظفون قبل أن يبدأ منحنى الاندماج الوظيفي في الهبوط.
- في حال غياب النمو المهني ← تفعيل مراجعة استراتيجية للمسارات الوظيفية.
- في حال رصد الإرهاق الوظيفي ← إجراء تدوير للمشاريع أو إعادة مواءمة الأعباء التشغيلية.
- في حال تراجع الشعور بقيمة العمل ← تعزيز برامج التقدير وربط الموظفين بالأهداف الاستراتيجية.
هذه الخطوات بسيطة في جوهرها، لكن سحرها في "توقيتها". فعندما تضع الدعم والوضوح والتقدير في اللحظة المناسبة، فإنك تغير مستقبل تجربة الموظف بالكامل.
اكتشف "منحنى الهبوط" قبل هروب الكفاءات
تحليل مدة الخدمة هو "الرادار" الذي يمنح قادة الموارد البشرية القدرة على توقع رحيل الموظفين وتقديم استقالاتهم. عندما تعرف "متى" و"لماذا" يبدأ التراجع، ستتمكن من إنقاذ الموقف قبل فقدان الاندماج.
نحن لا نهدف إلى محو المنحنى فحسب، بل لإطالة أمد الإبداع والإنتاجية. الشركات التي تنجح في تأخير هذا التراجع لمدة تتراوح بين 3 إلى 6 أشهر فقط، تحقق قفزة نوعية في معدلات الاحتفاظ بالمواهب والكفاءات. فكلما طال اندماج الموظف، زاد ولاؤه وقيمته المضافة داخل مؤسّستك.
تجعل منصّة "إنغيجسوفت" هذا ممكنًا من خلال تزويدك بالأدوات اللازمة لعزل بيانات كل فئة وظيفية وفهم دوافع تراجعها ومقارنتها بدقة، مما يُحسِّن مِن الاحتفاظ بالمواهب دون الاعتماد على التخمين.
هل أنت مستعد لاكتشاف "منحنى الهبوط" في مؤسستك؟ فريقنا جاهز لمساعدتك في تحليل بياناتك.
احجز عرضًا تجريبيًّا الآن واكتشف كيف تبني استراتيجية لا تقهر للاحتفاظ بأفضل الكفاءات والمواهب.